eyeWeather
Backstage
Here's some things you might not know about eyeWeather.

Technology
eyeWeather uses D3.js, a powerful JavaScript library for low-level data visualization. While starting my journey into the world of data, I came across an outstanding presentation by Nadieh Bremer, showing how D3 can leverage Scaleable Vector Graphics (SVG) to create stunning visualizations. This inspired me to dive into D3 and build eyeWeather.
While D3 is an excellent tool for visualizations, it is not designed to build an entire website. So I looked for front-end framework that would seamlessly integrate with D3 and discovered Svelte. Svelte compiles and optimizes code during the build process, resulting in reduced browser load and faster performance. It mostly uses standard HTML, CSS, and JavaScript, making it simple to learn and easy to use.
Background
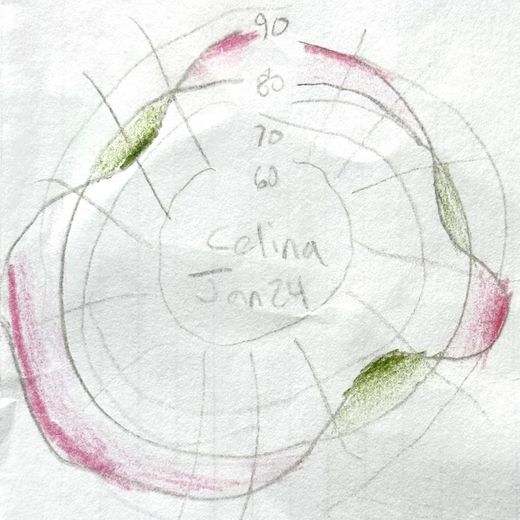
Ever since smartphones could use third-party apps, I've been on on a quest to find the perfect weather app. I haven't found it yet, but given how well weather data lends itself to visualization, I decided to give building one a shot. I thought it would be a fun challenge to visualize data in a circle, so this was perfect for my first D3 project. It all started with the pictured sketch.
The radial visualization approach has its challenges and limitations, but it reveals patterns and changes in the cyclical nature of weather data well. Also, I love a good gradient, so it ended up looking like the iris of an eye, thus eyeWeather.
Don't Miss
Here are a few tips or features you shouldn't miss:
- The wind icon rotates to show the wind direction
- The colors, shapes, and text smoothly transition
- Tapping on the hours or the triangle select that time
Planned Features
Here's what else I'd like to do with eyeWeather:
- Add weather conditions (e.g., partly cloudy)
- Add the daily forecast
- Show precipitation for the next hour
- Add a dark mode
- Add sun/moon information
- Add user settings